We conduct a study of the fuel consumption of cars in Stata’s auto dataset.
. sysuse auto, clear
(1978 Automobile Data)
We generate a variable, fuel, that measures the fuel consumption rate in the unit of Gallons per 100 Miles.
. generate fuel = 100/mpg

. label variable fuel "Fuel consumption (Gallons per 100 Miles)"
We examine variables for possible errors in the data.
. describe fuel weight

              storage   display    value
variable name   type    format     label      variable label
--------------------------------------------------------------------------------
fuel            float   %9.0g                 Fuel consumption (Gallons per 100
                                                Miles)
weight          int     %8.0gc                Weight (lbs.)
. summarize weight

    Variable |        Obs        Mean    Std. Dev.       Min        Max
-------------+---------------------------------------------------------
      weight |         74    3019.459    777.1936       1760       4840
The variable weight has minimum value 1760.00, maximum value 4840.00, and range 3080.00.
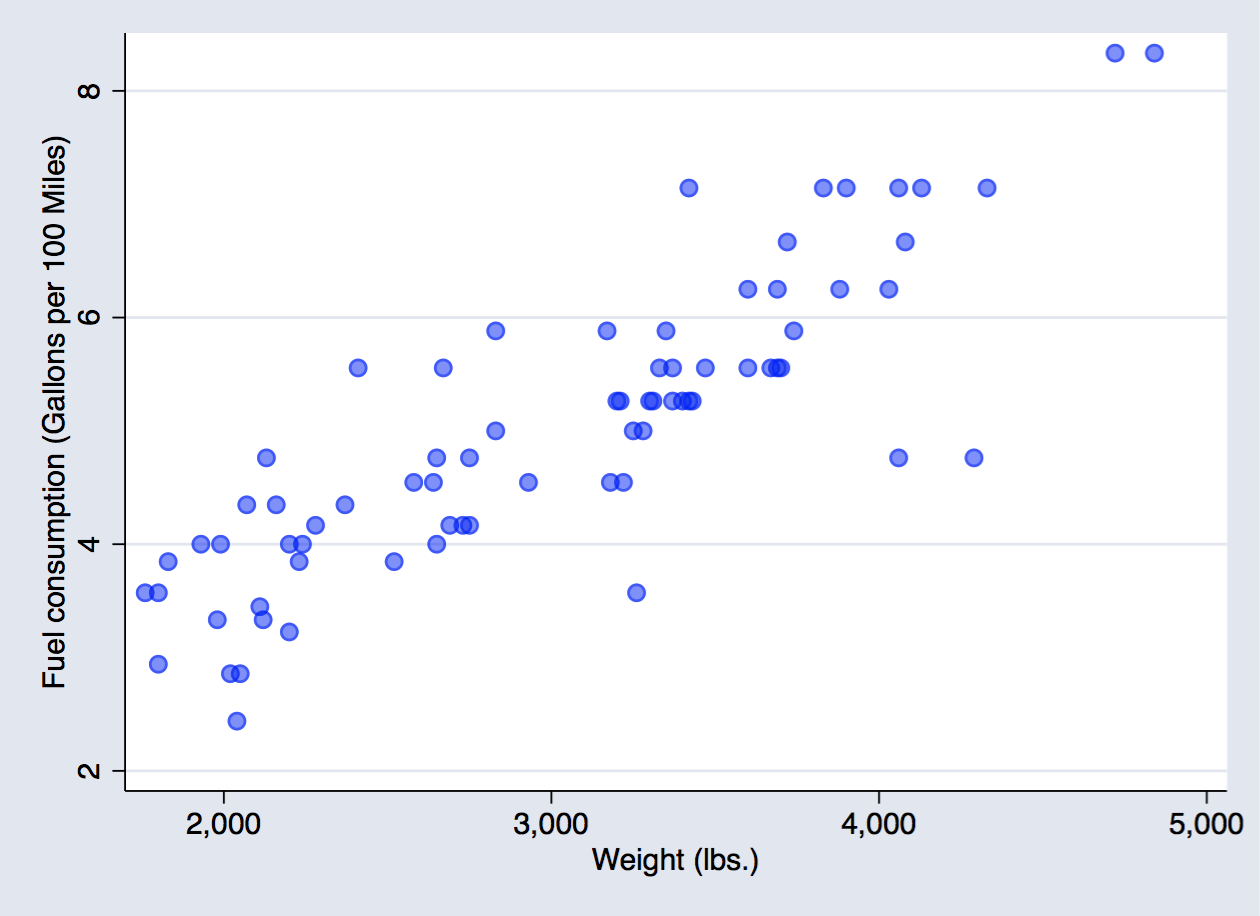
. scatter fuel weight, mcolor(blue%50)
. regress fuel weight

      Source |       SS           df       MS      Number of obs   =        74
-------------+----------------------------------   F(1, 72)        =    194.71
       Model |  87.2964969         1  87.2964969   Prob > F        =    0.0000
    Residual |  32.2797639        72  .448330054   R-squared       =    0.7300
-------------+----------------------------------   Adj R-squared   =    0.7263
       Total |  119.576261        73  1.63803097   Root MSE        =    .66957

------------------------------------------------------------------------------
        fuel |      Coef.   Std. Err.      t    P>|t|     [95% Conf. Interval]
-------------+----------------------------------------------------------------
      weight |    .001407   .0001008    13.95   0.000      .001206    .0016081
       _cons |   .7707669   .3142571     2.45   0.017     .1443069    1.397227
------------------------------------------------------------------------------
The regression shows that for every unit increase in weight, a 0.0014 unit increase in fuel consumption is predicted.
. _coef_table, markdown
| fuel | Coef. | Std. Err. | t | P>|t| | [95% Conf. Interval] | |
|---|---|---|---|---|---|---|
| weight | .001407 | .0001008 | 13.95 | 0.000 | .001206 | .0016081 |
| _cons | .7707669 | .3142571 | 2.45 | 0.017 | .1443069 | 1.397227 |
. quietly regress fuel weight gear turn

. estimates store model1

. quietly regress fuel weight gear turn foreign

. estimates store model2

. estimates table model1 model2, b(%7.4f) stats(N r2_a) star

----------------------------------------
    Variable |   model1       model2
-------------+--------------------------
      weight |  0.0014***    0.0013***
  gear_ratio |  0.1706      -0.3367
        turn |  0.0243       0.0613
     foreign |               0.8650***
       _cons | -0.5814      -0.4661
-------------+--------------------------
           N |      74           74
        r2_a |  0.7218       0.7637
----------------------------------------
legend: * p<0.05; ** p<0.01; *** p<0.001
. estimates table model1 model2, varlabel b(%7.4f) stats(N r2_a) star markdown
| Variable | model1 | model2 |
|---|---|---|
| Weight (lbs.) | 0.0014*** | 0.0013*** |
| Gear Ratio | 0.1706 | -0.3367 |
| Turn Circle (ft.) | 0.0243 | 0.0613 |
| Car type | 0.8650*** | |
| Constant | -0.5814 | -0.4661 |
| N | 74 | 74 |
| r2_a | 0.7218 | 0.7637 |
legend: * p<0.05; ** p<0.01; *** p<0.001
. eststo : quietly regress fuel weight gear turn
(est1 stored)

. eststo : quietly regress fuel weight gear turn foreign
(est2 stored)

. esttab using esttab_ex.html, label   ///
>         width(80%) nogaps                ///
>         mtitles("Model 1" "Model 2")       ///
>         title(Regression table using -esttab-)
(output written to esttab_ex.html)
| (1) | (2) | |
| Model 1 | Model 2 | |
| Weight (lbs.) | 0.00136*** | 0.00126*** |
| (6.09) | (6.06) | |
| Gear Ratio | 0.171 | -0.337 |
| (0.64) | (-1.19) | |
| Turn Circle (ft.) | 0.0243 | 0.0613 |
| (0.70) | (1.81) | |
| Car type | 0.865*** | |
| (3.66) | ||
| Constant | -0.581 | -0.466 |
| (-0.38) | (-0.33) | |
| Observations | 74 | 74 |
|
t statistics in parentheses
* p < 0.05, ** p < 0.01, *** p < 0.001 | ||
The community-contributed esttab is available on the Boston College Statistical Software Components (SSC) archive; see ssc install for details.