scatter fuel weight
We conduct a study of the fuel consumption of cars in Stata's auto dataset.
. sysuse auto, clear
(1978 Automobile Data)
We generate a variable, fuel, that measures the fuel consumption rate in the unit of Gallons per 100 Miles.
. generate fuel = 100/mpg

. label variable fuel "Fuel consumption (Gallons per 100 Miles)"
We examine variables for possible errors in the data.
. describe fuel weight

              storage   display    value
variable name   type    format     label      variable label
--------------------------------------------------------------------------------
fuel            float   %9.0g                 Fuel consumption (Gallons per 100
                                                Miles)
weight          int     %8.0gc                Weight (lbs.)
. summarize weight

    Variable |        Obs        Mean    Std. Dev.       Min        Max
-------------+---------------------------------------------------------
      weight |         74    3019.459    777.1936       1760       4840
The variable weight has minimum value 1760.00, maximum value 4840.00, and range 3080.00.
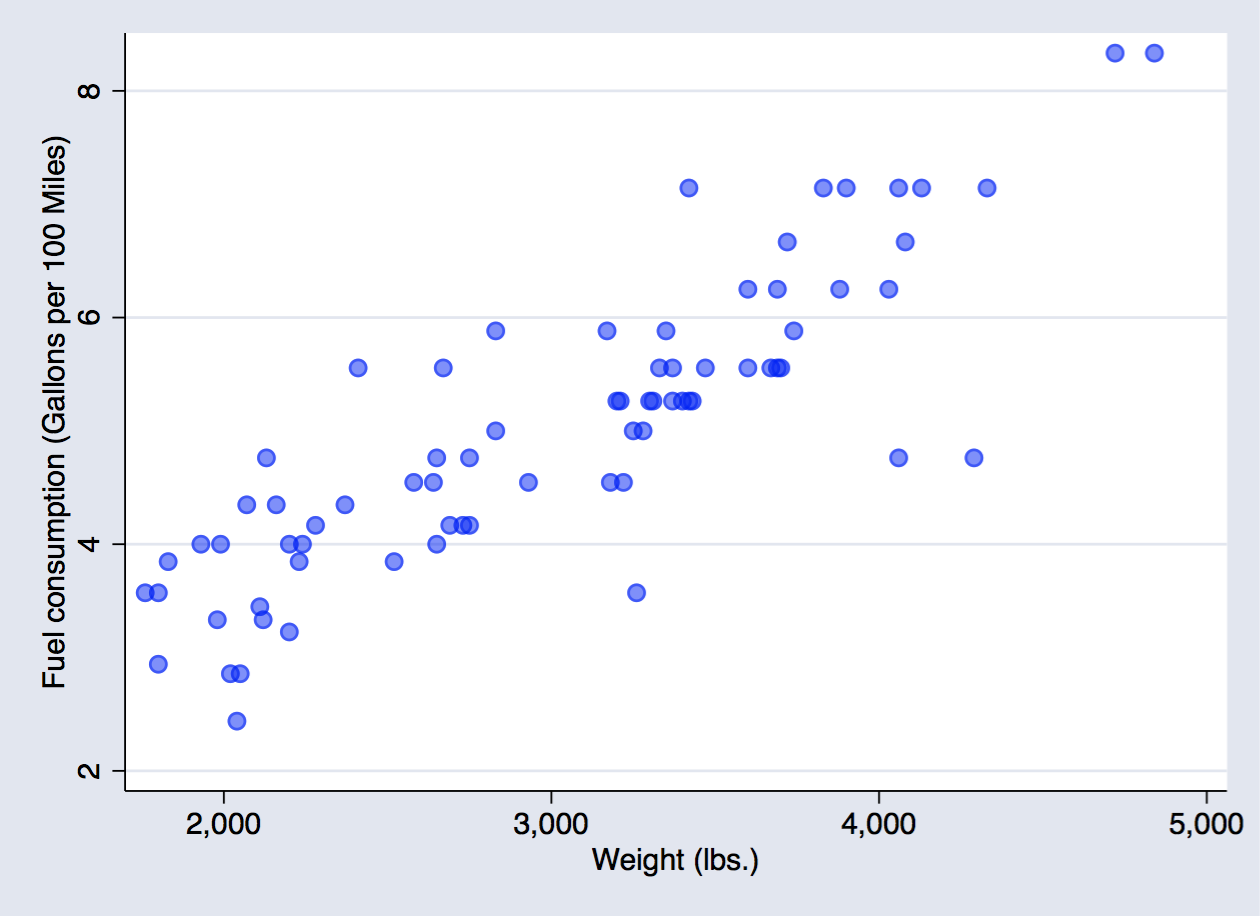
. scatter fuel weight, mcolor(blue%50)
scatter fuel weight
. regress fuel weight

      Source |       SS           df       MS      Number of obs   =        74
-------------+----------------------------------   F(1, 72)        =    194.71
       Model |  87.2964969         1  87.2964969   Prob > F        =    0.0000
    Residual |  32.2797639        72  .448330054   R-squared       =    0.7300
-------------+----------------------------------   Adj R-squared   =    0.7263
       Total |  119.576261        73  1.63803097   Root MSE        =    .66957

------------------------------------------------------------------------------
        fuel |      Coef.   Std. Err.      t    P>|t|     [95% Conf. Interval]
-------------+----------------------------------------------------------------
      weight |    .001407   .0001008    13.95   0.000      .001206    .0016081
       _cons |   .7707669   .3142571     2.45   0.017     .1443069    1.397227
------------------------------------------------------------------------------
The regression shows that for every unit increase in weight, a 0.0014 unit increase in fuel consumption is predicted.